MailChimp

Comparative reports

My Role

Product Designer

The Challenge

We noticed a trend while examining customer feedback: users were manually creating spreadsheets of stats from each campaign they sent so they could track their performance over time.

The Solution

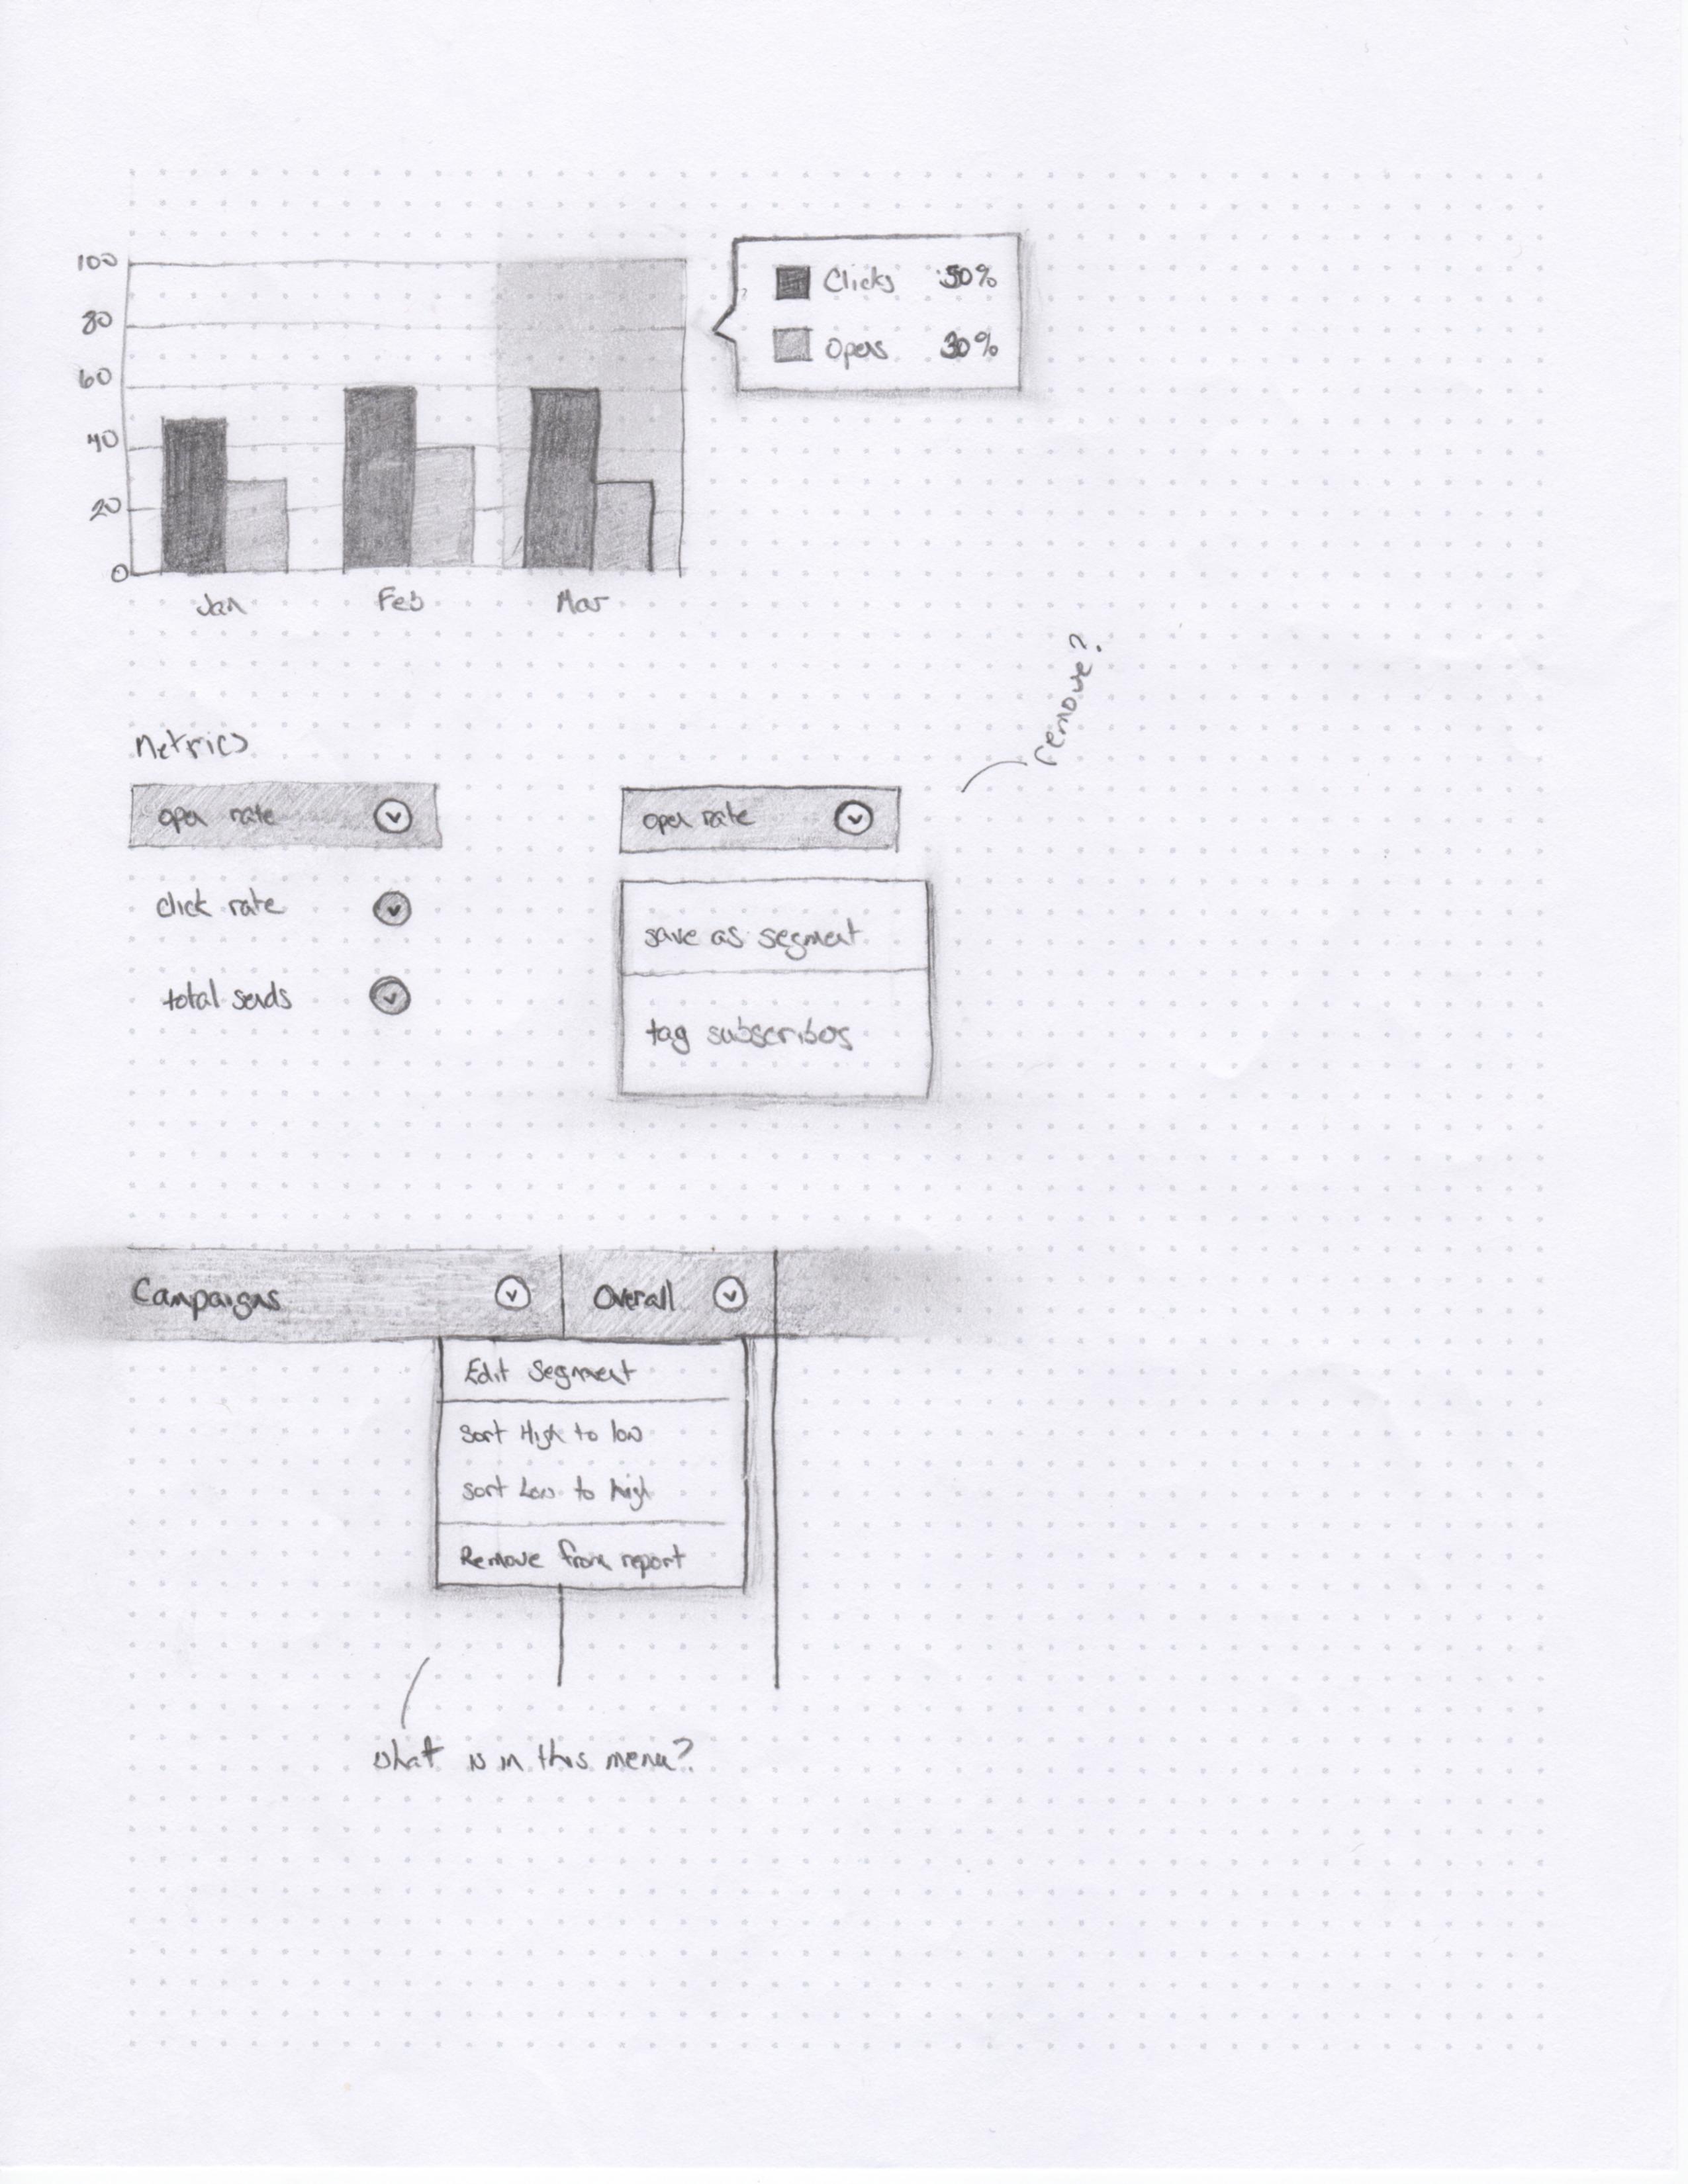
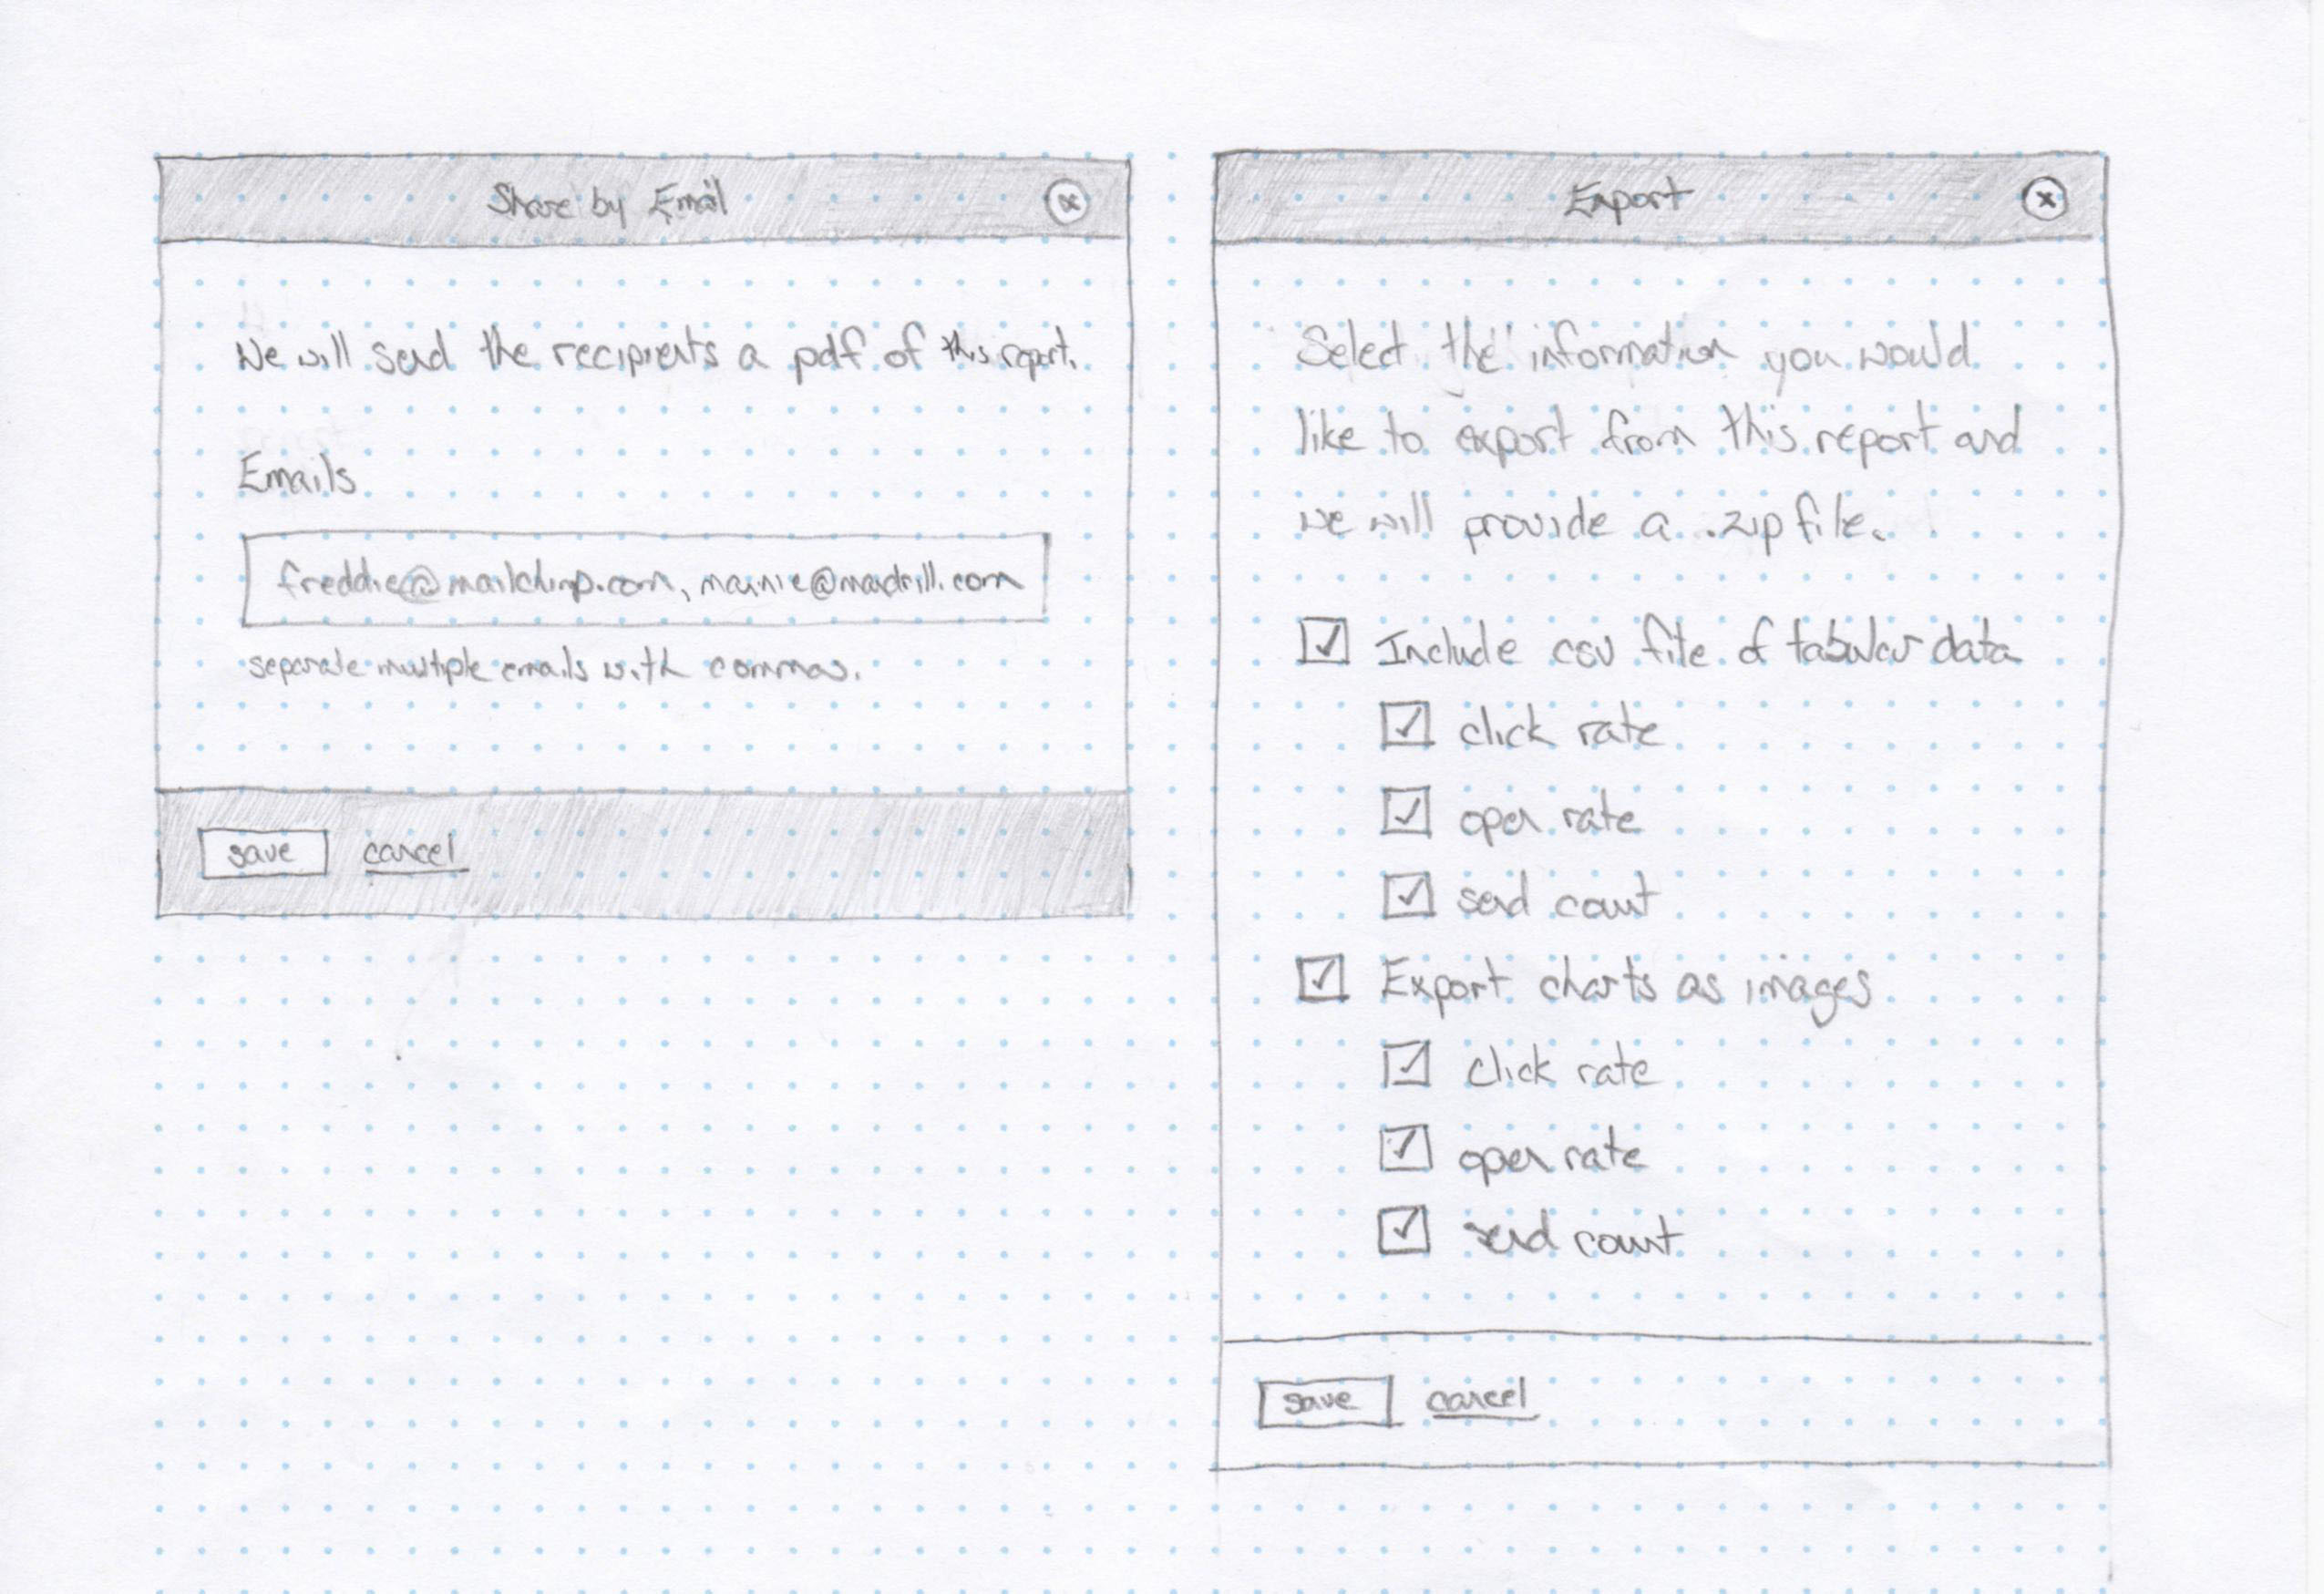
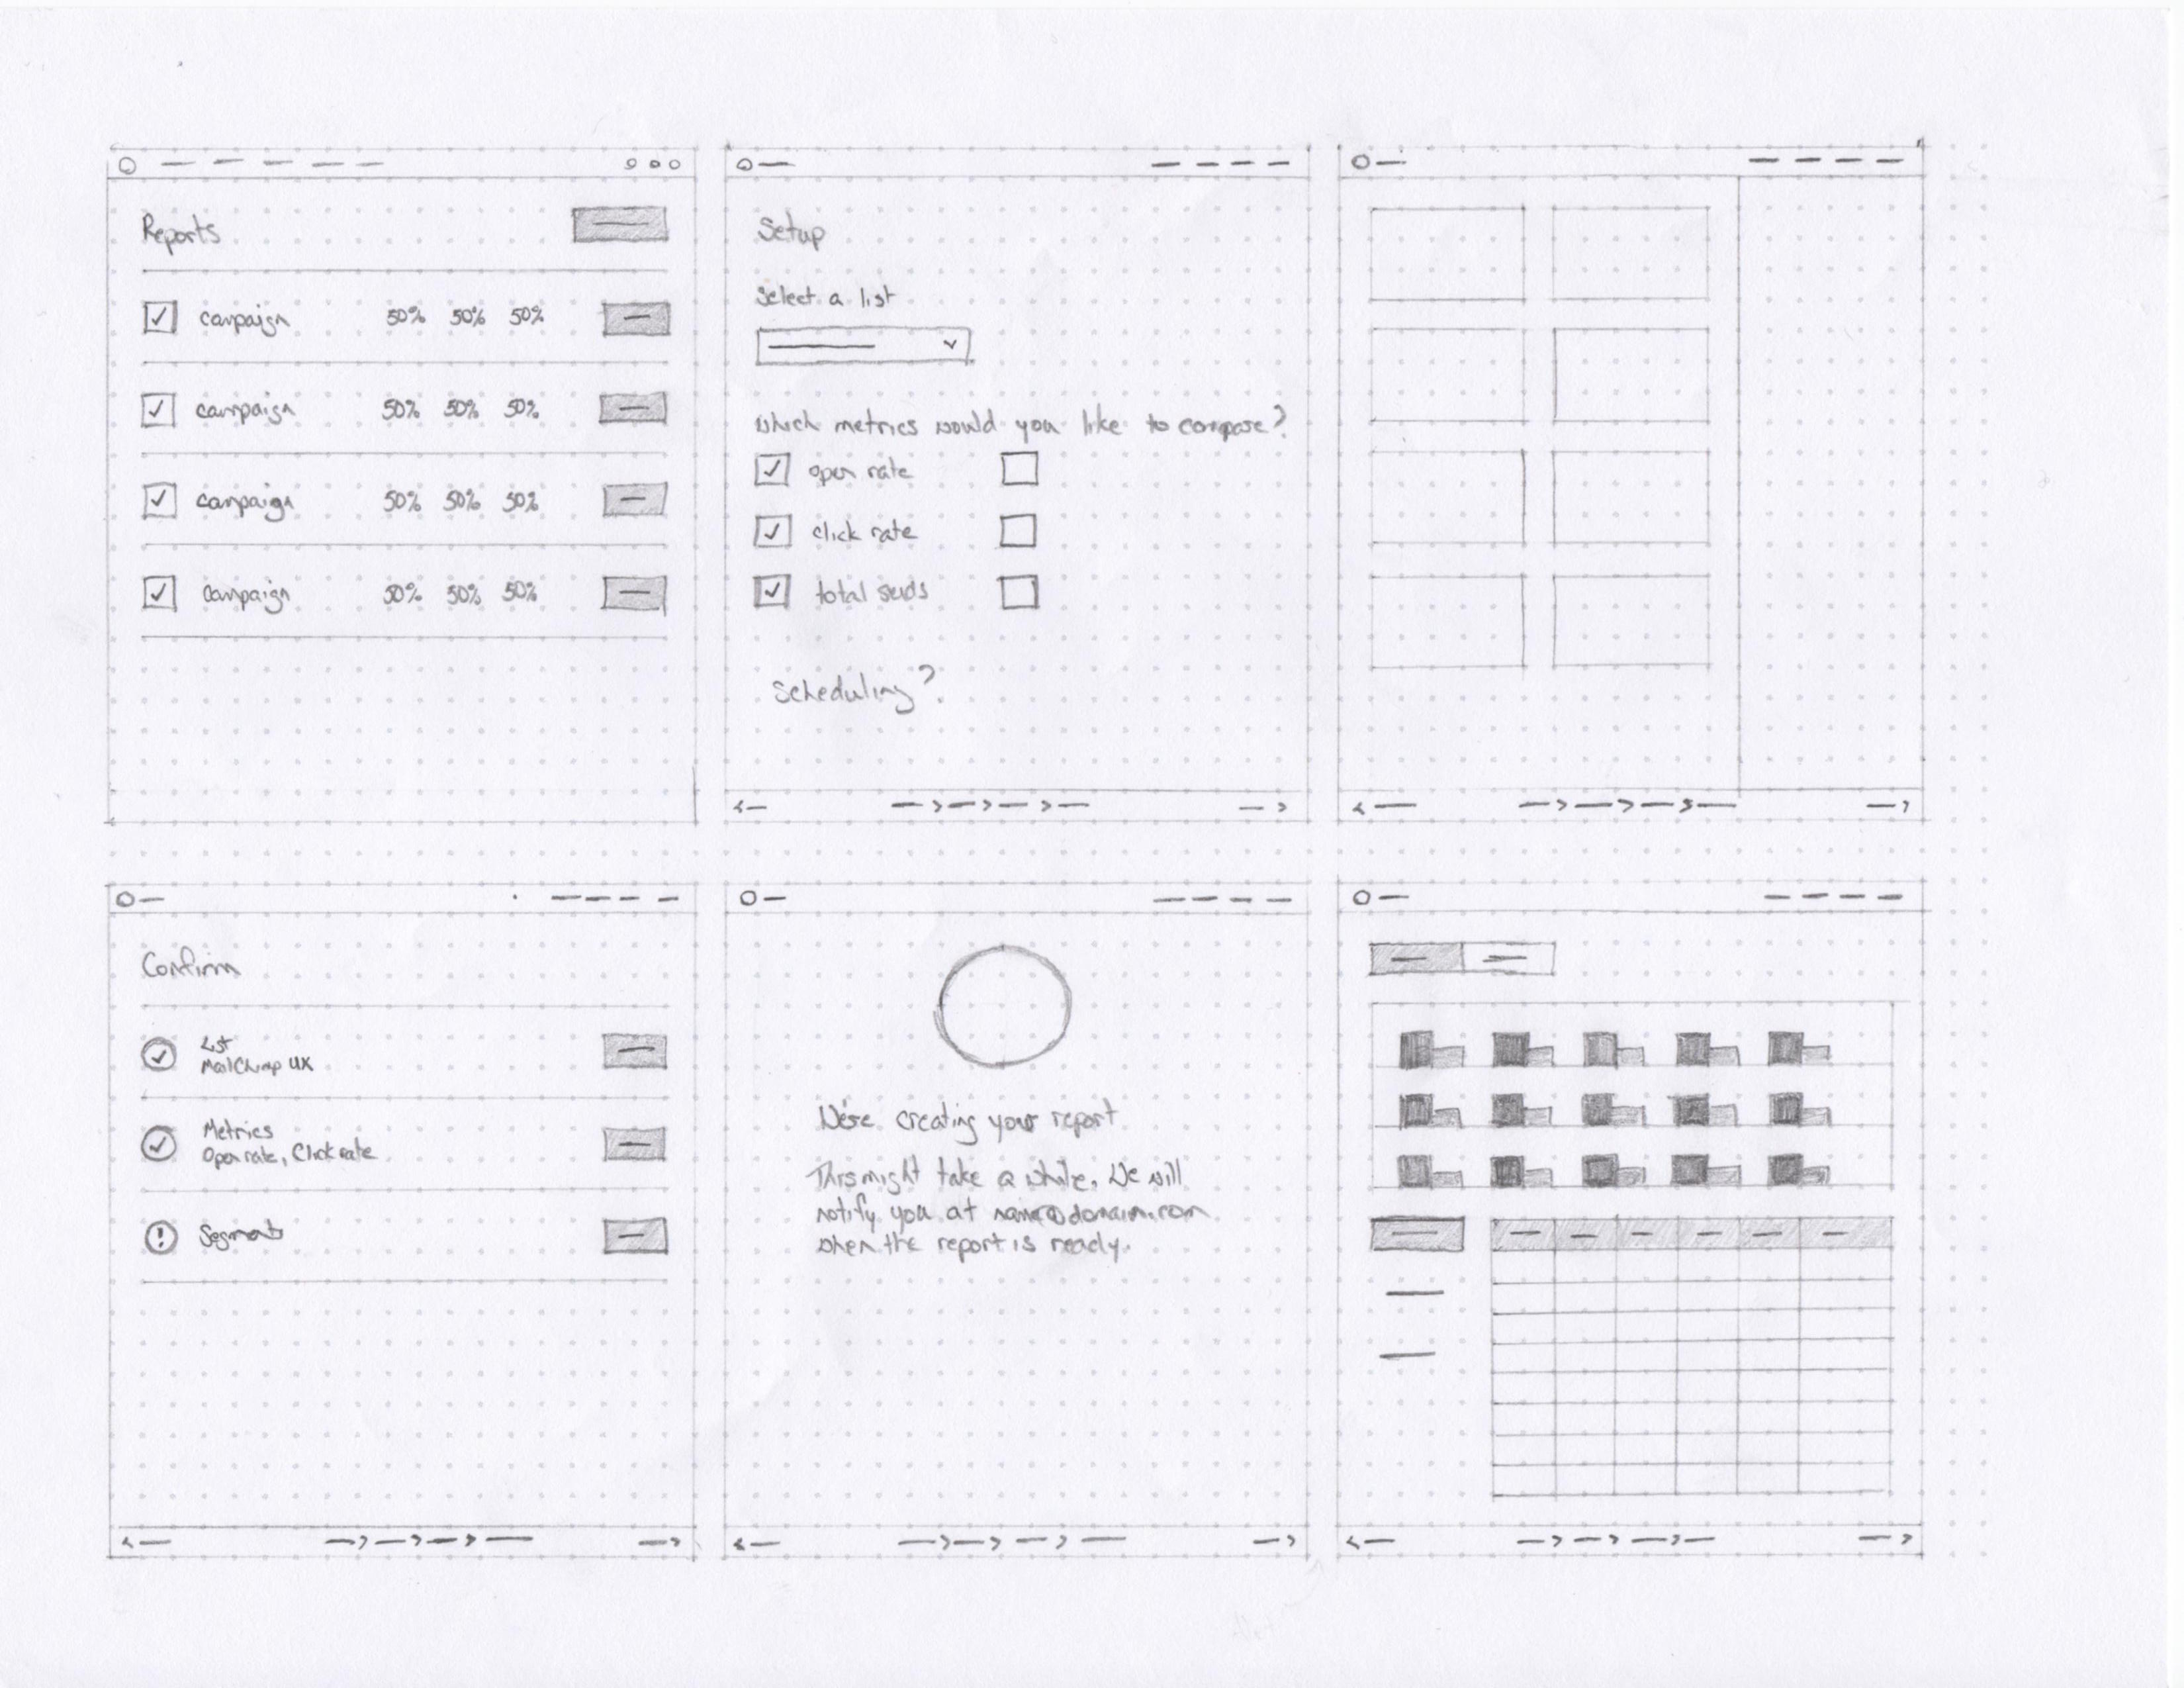
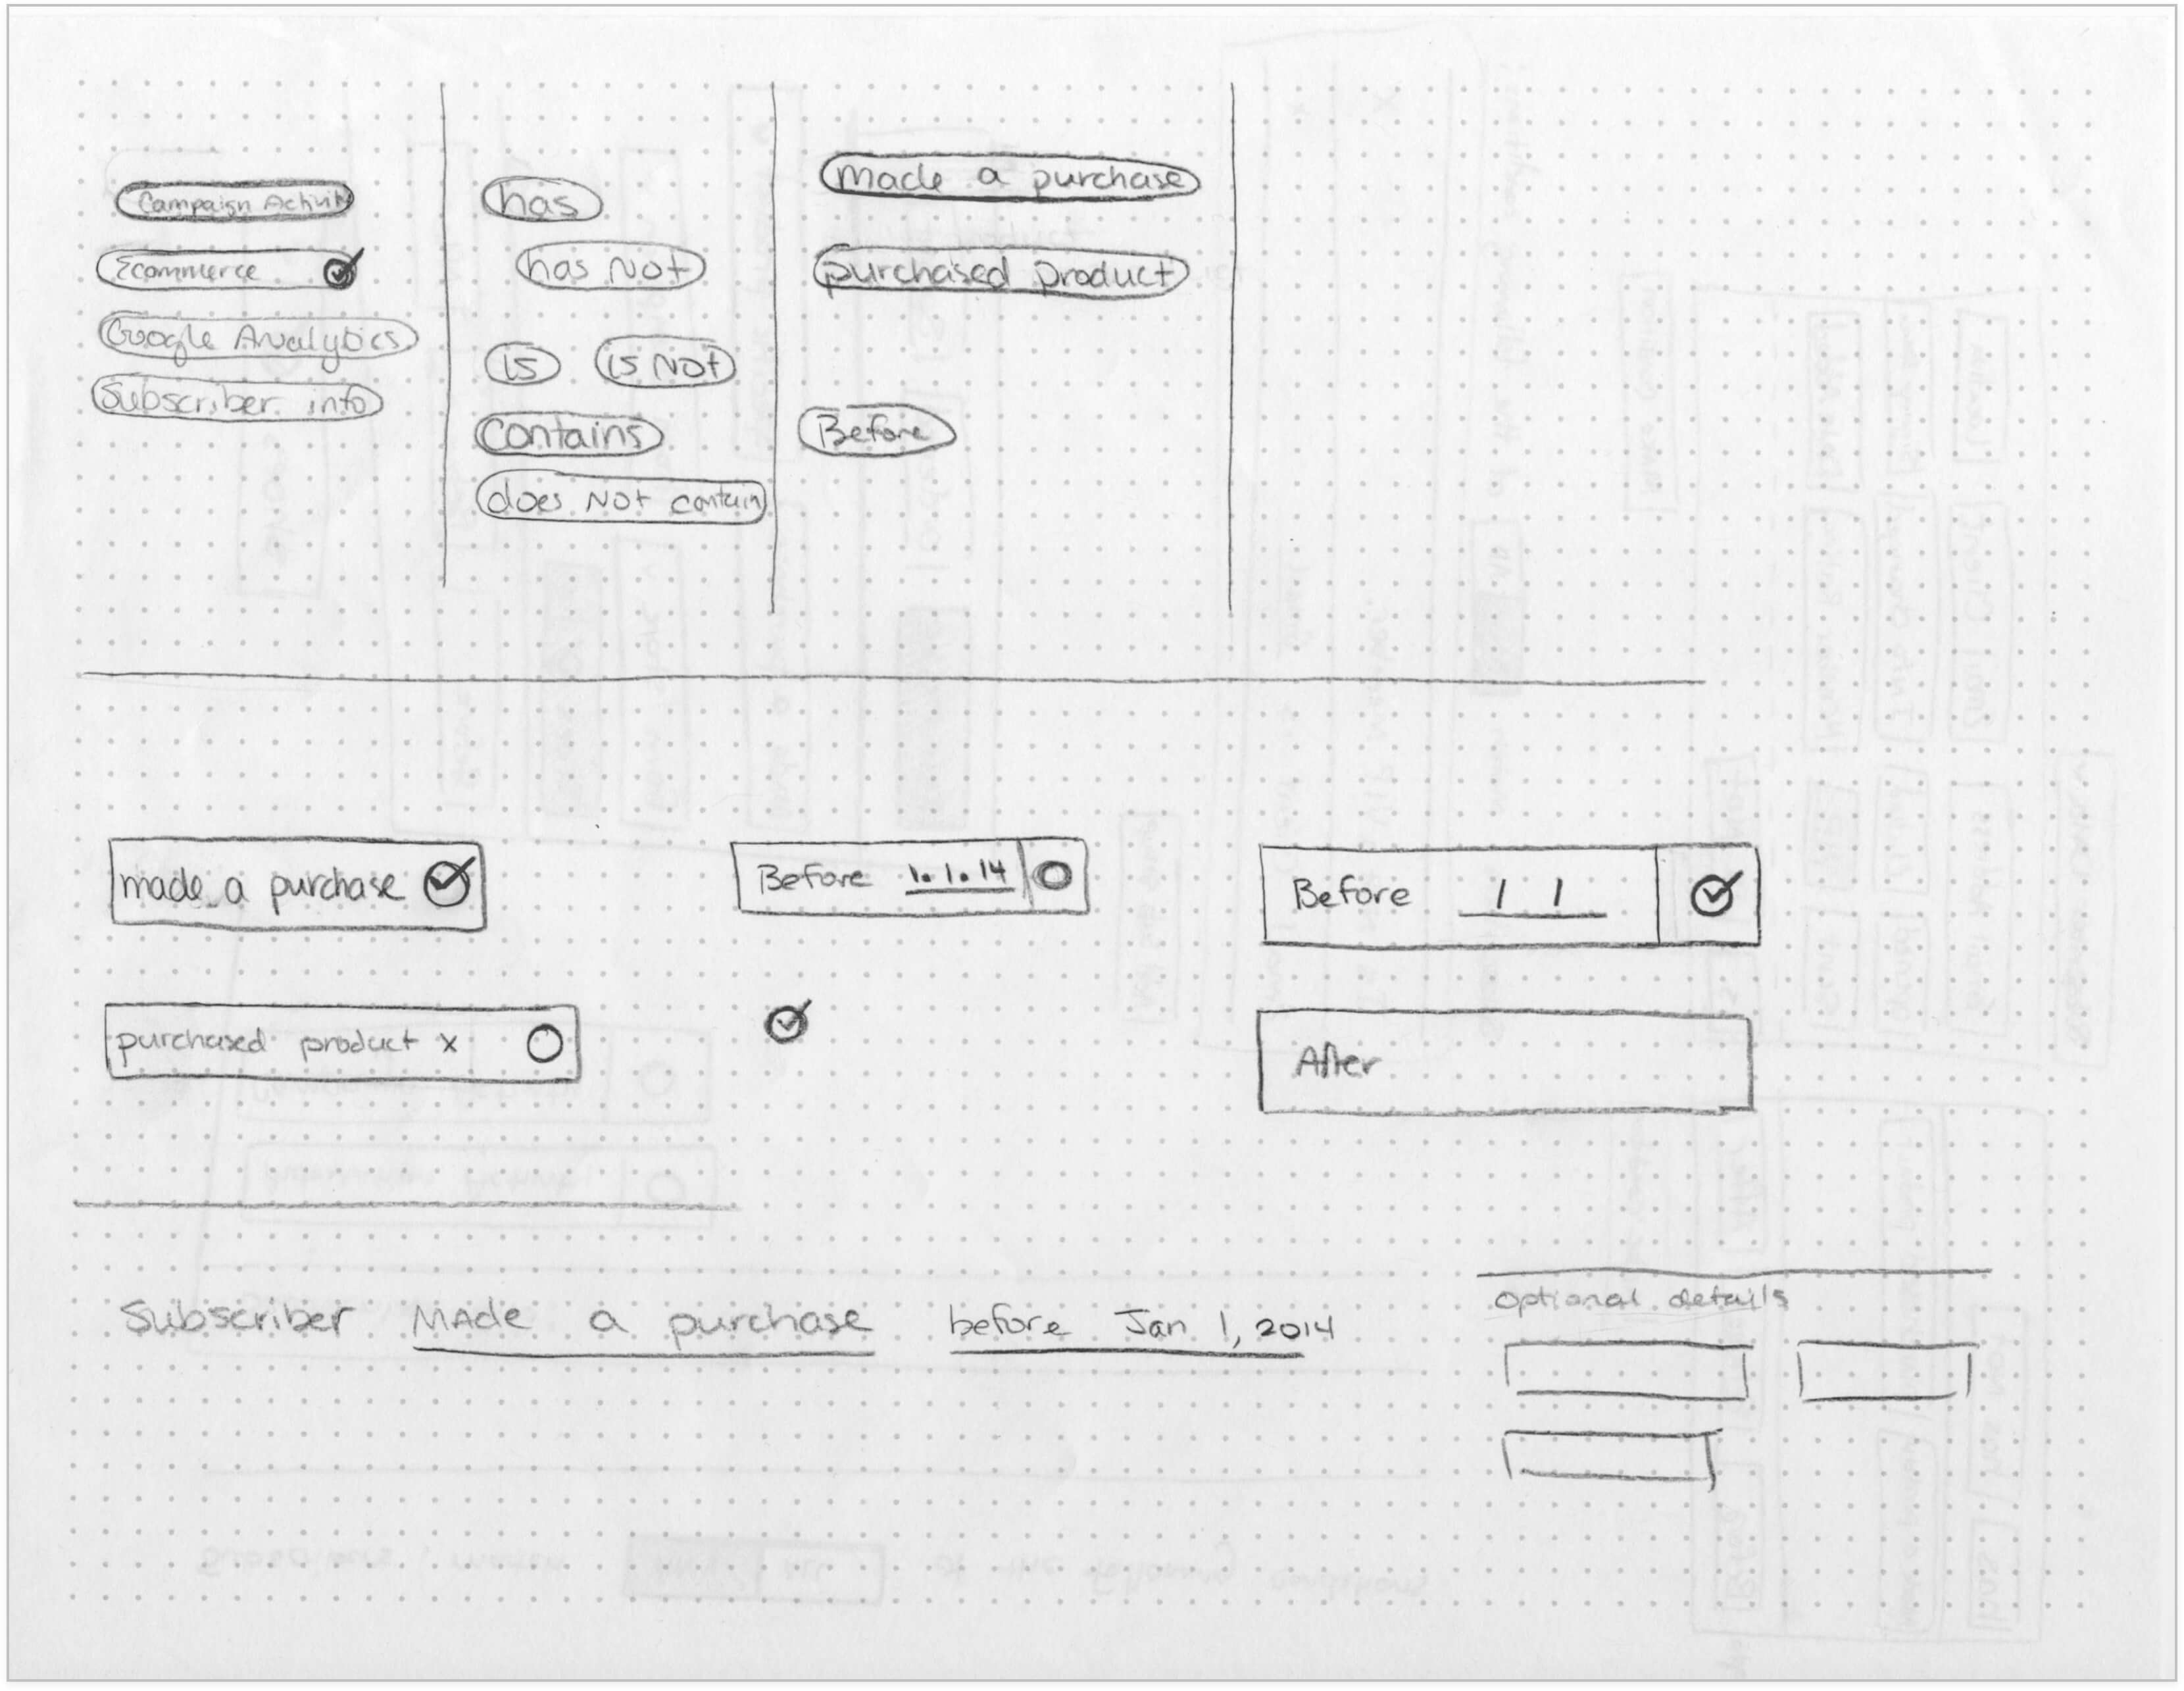
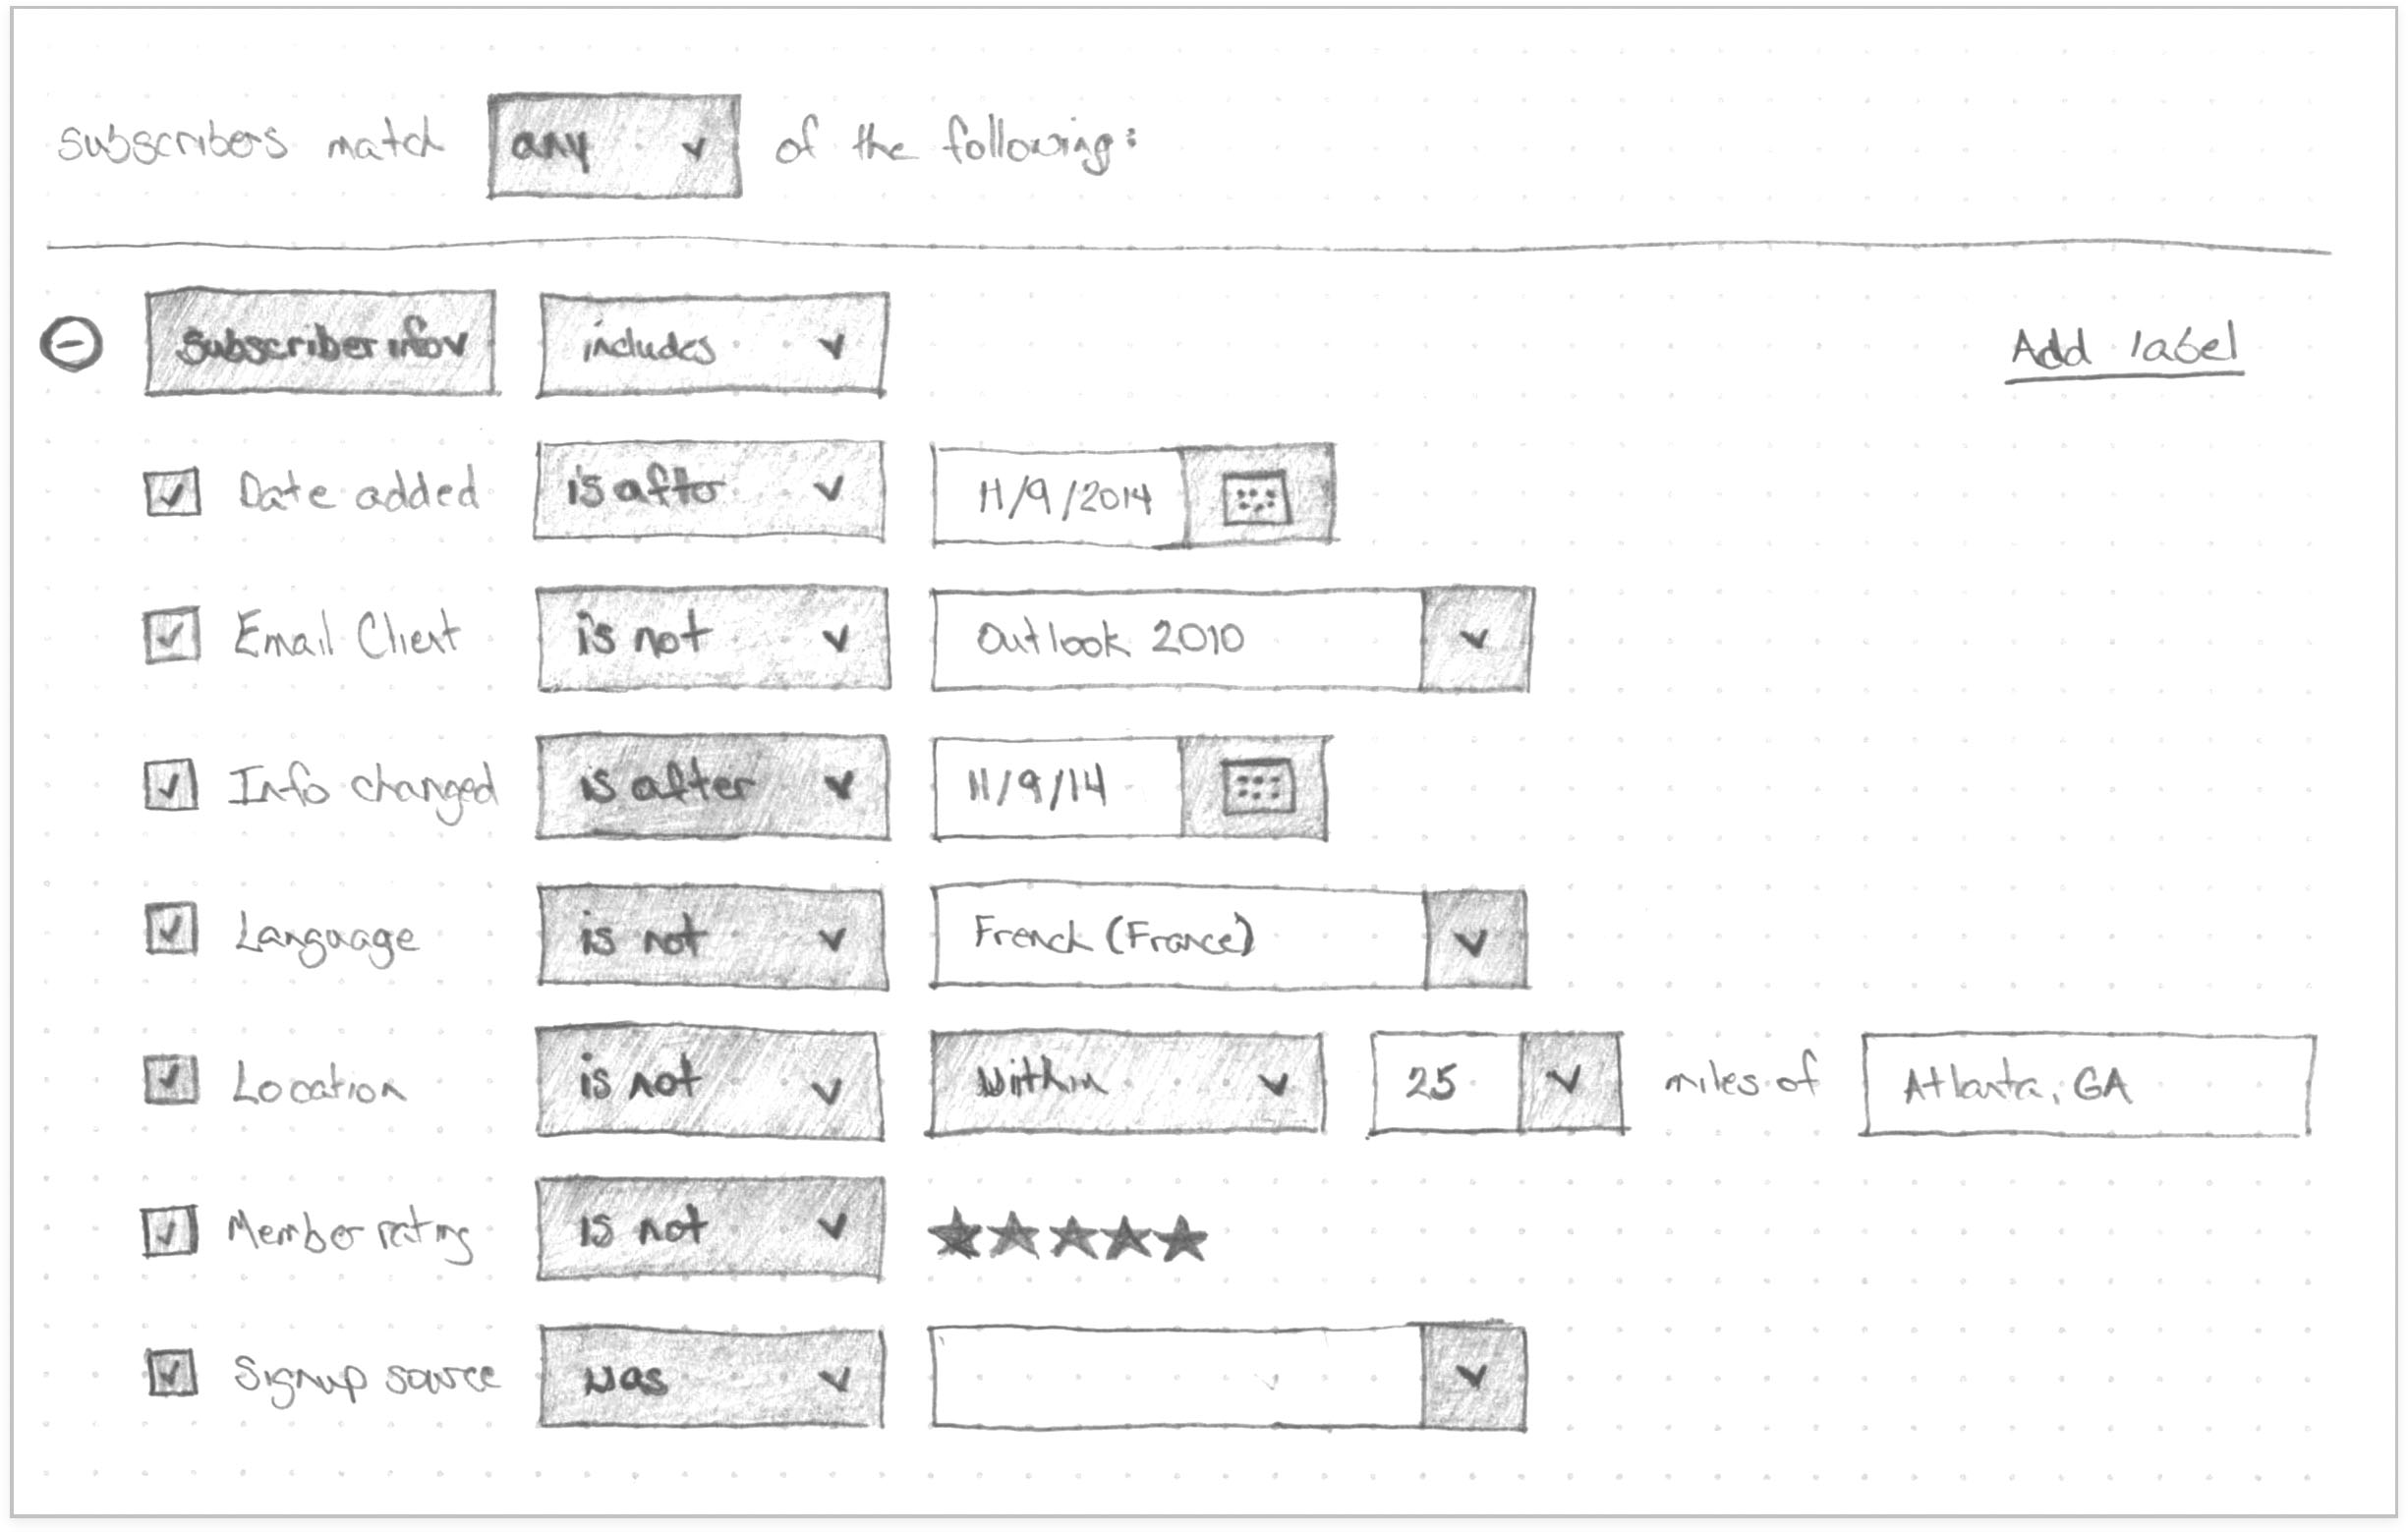
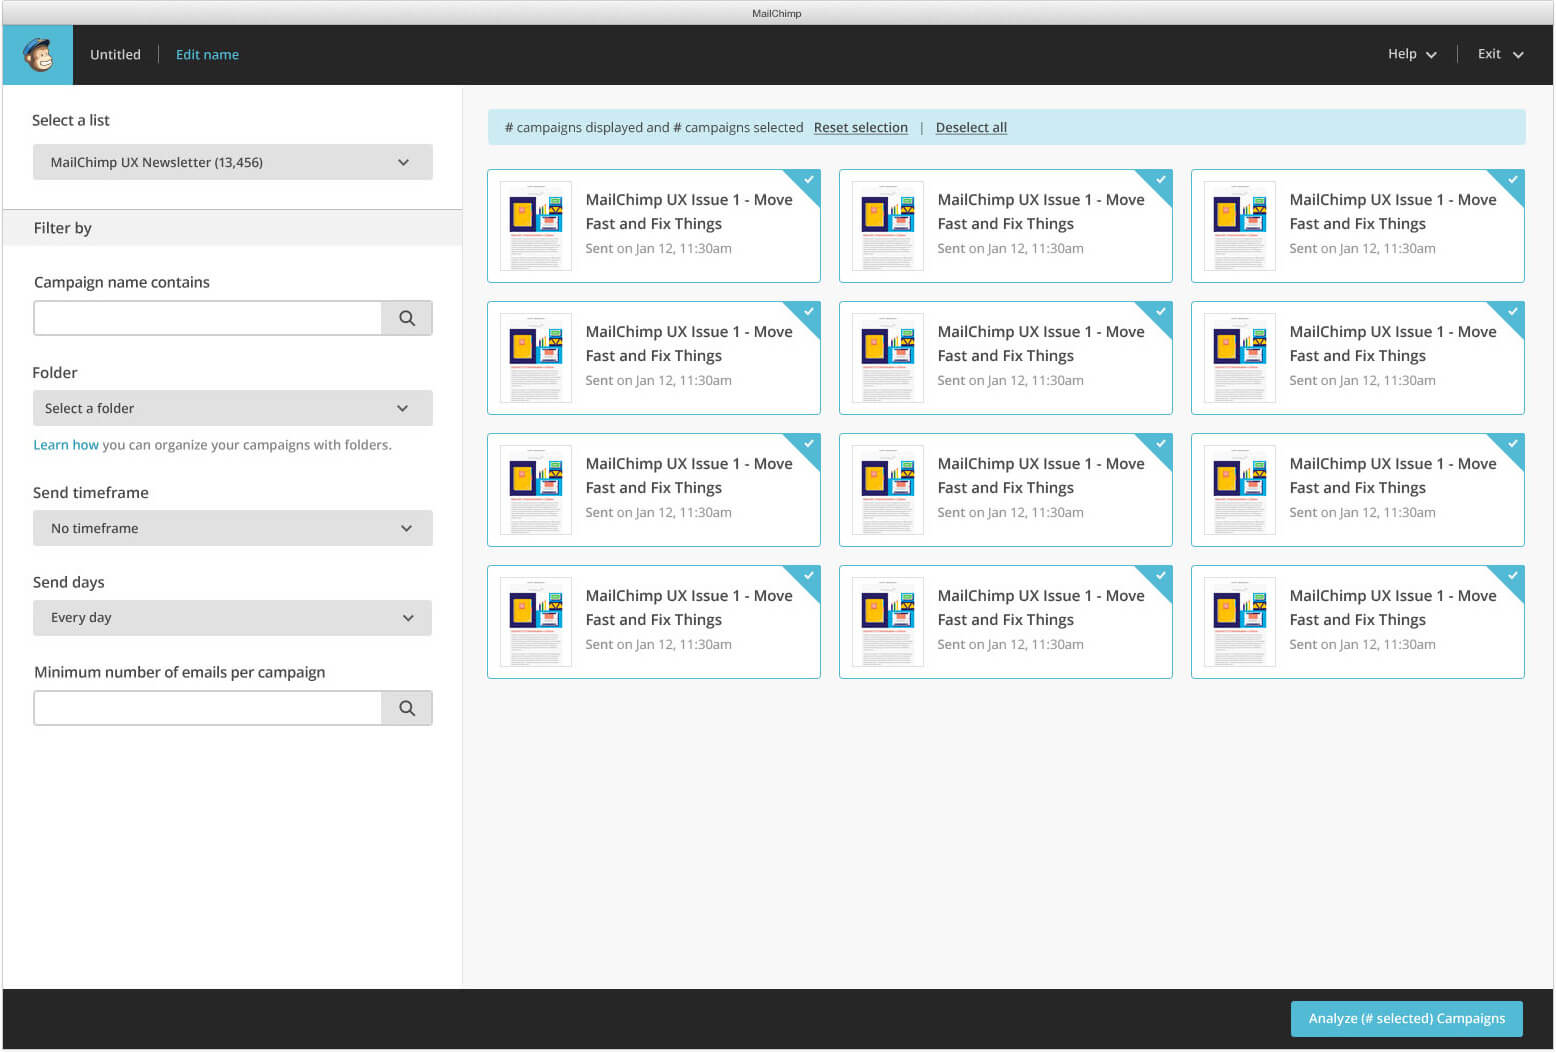
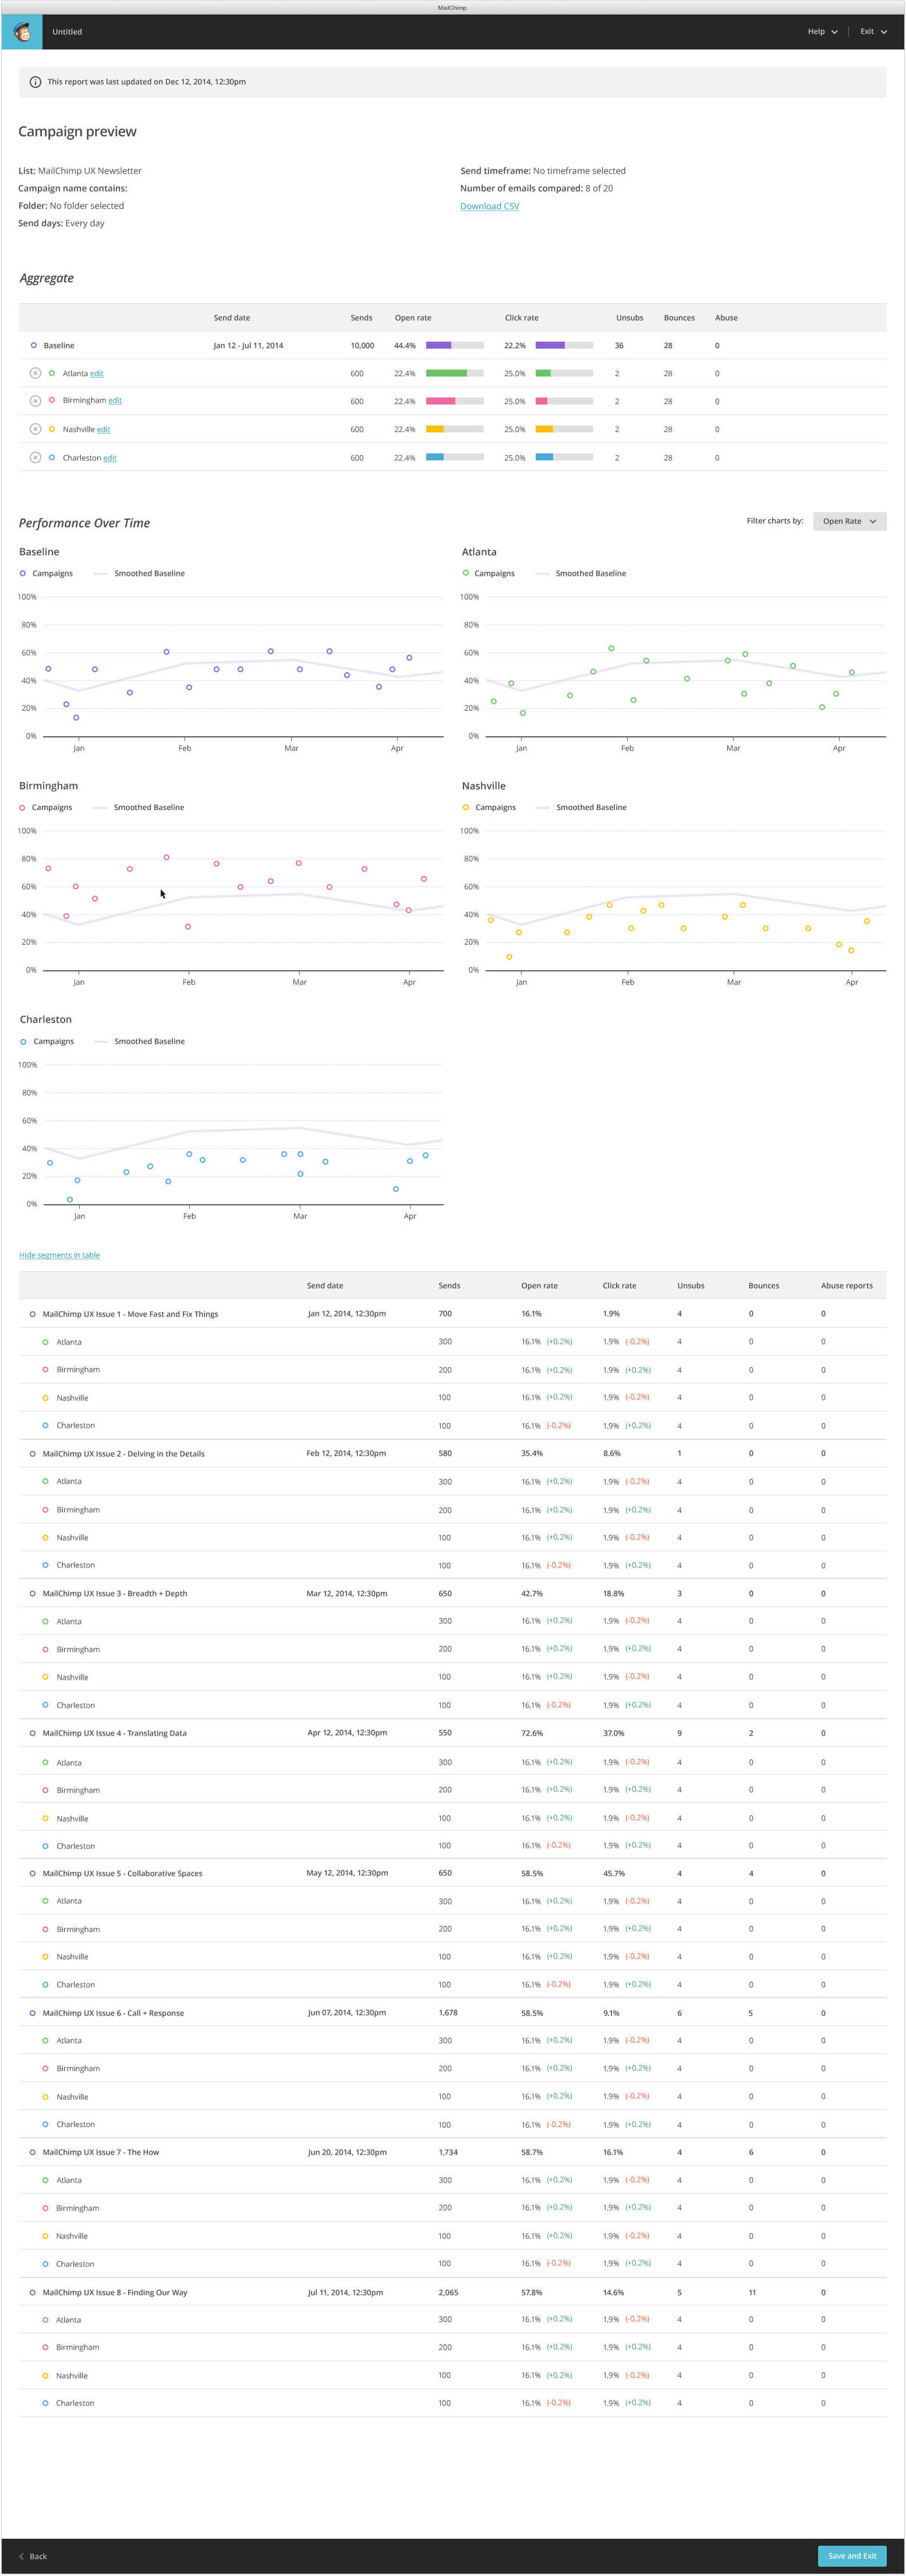
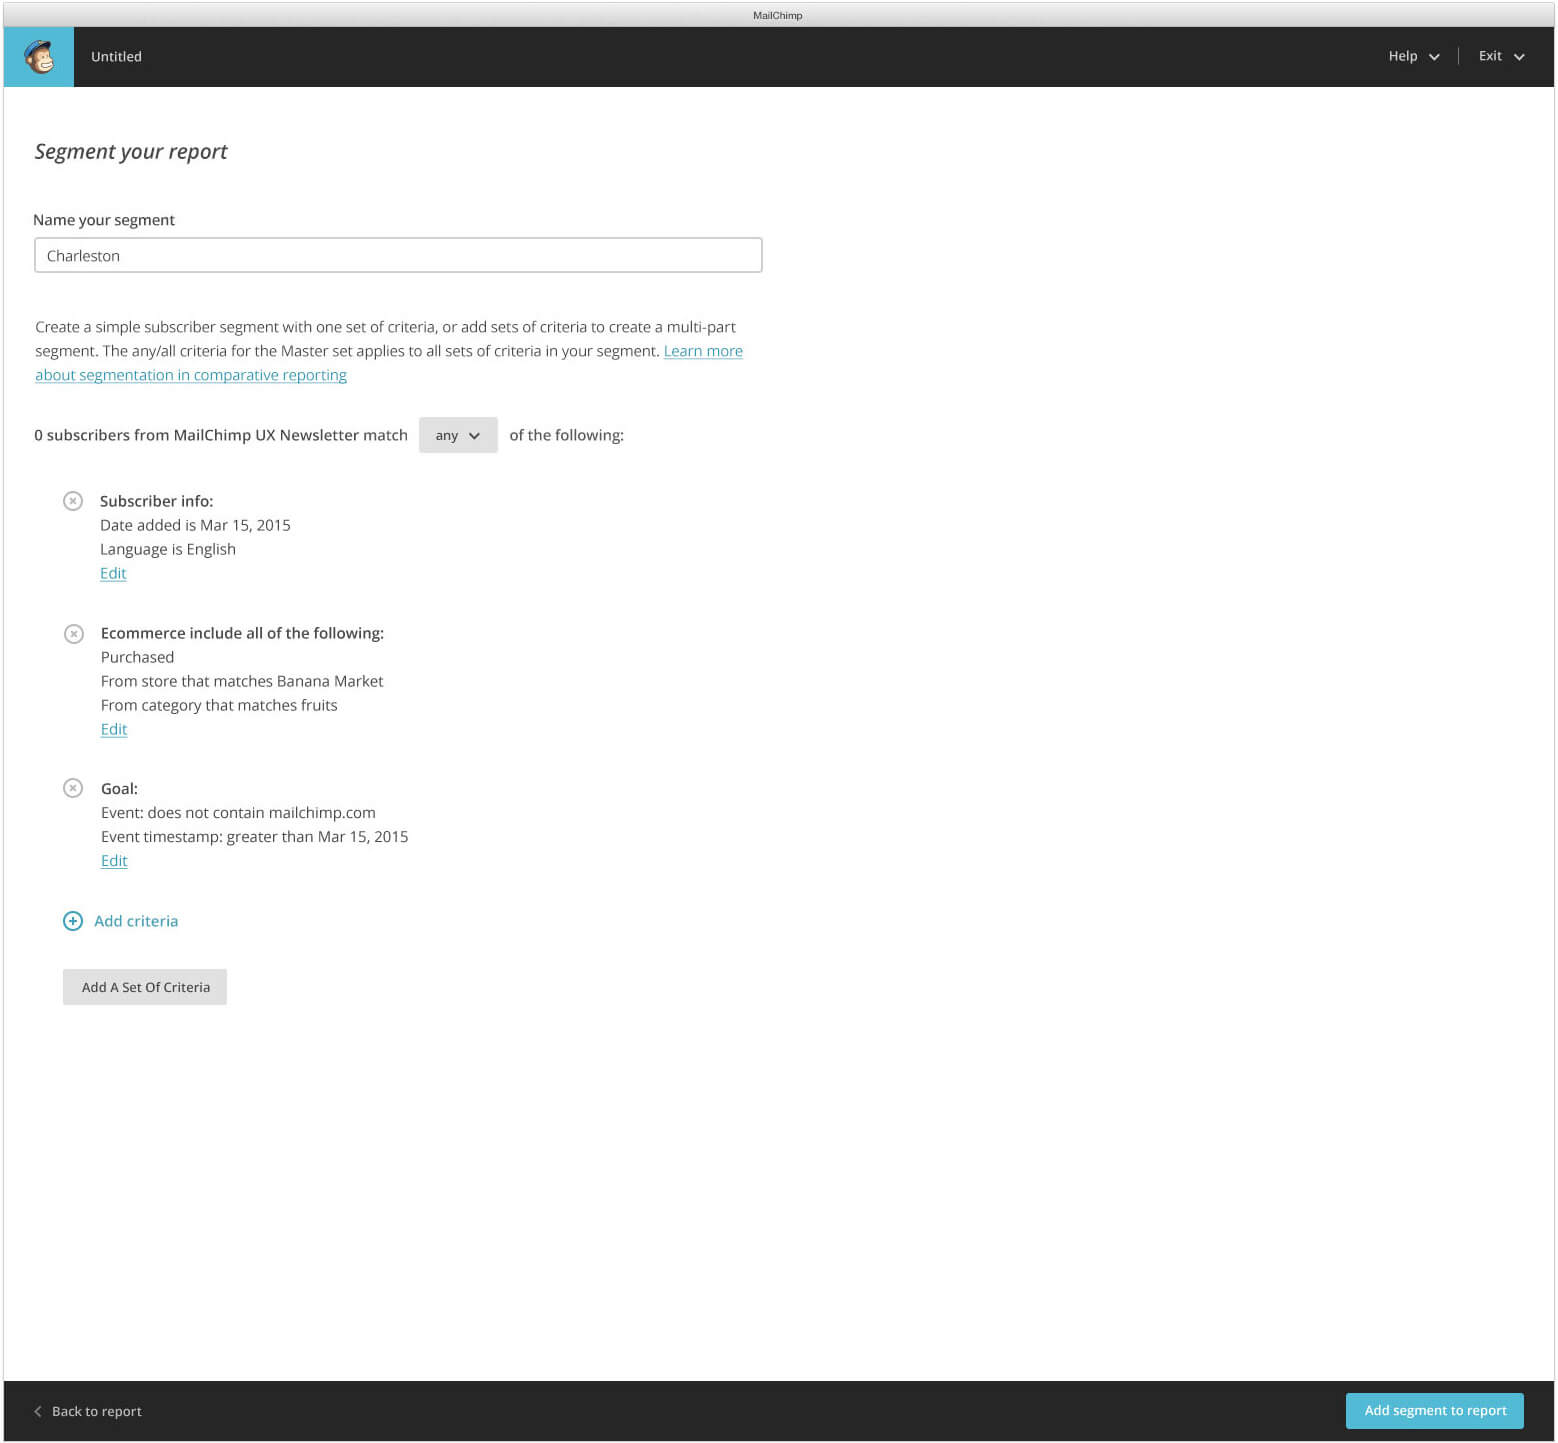
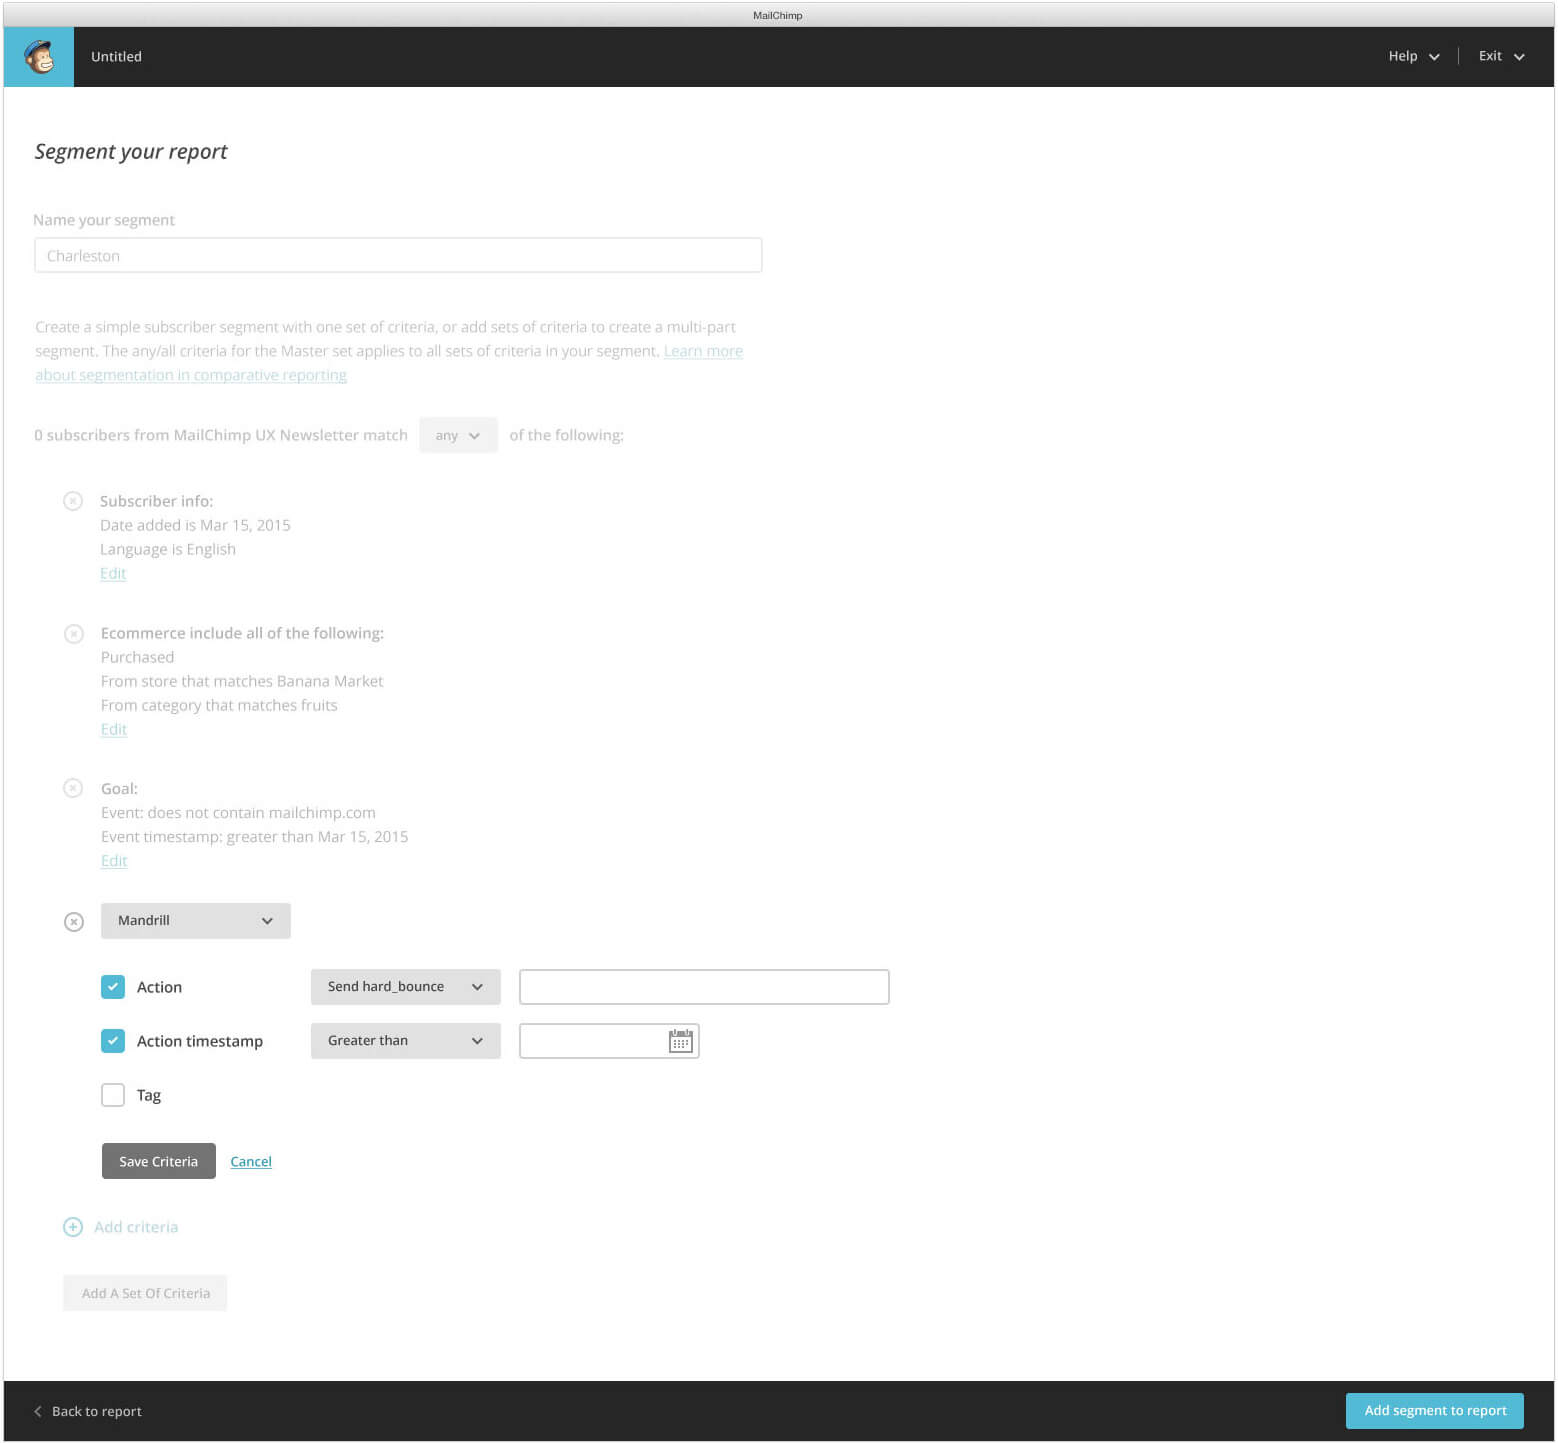
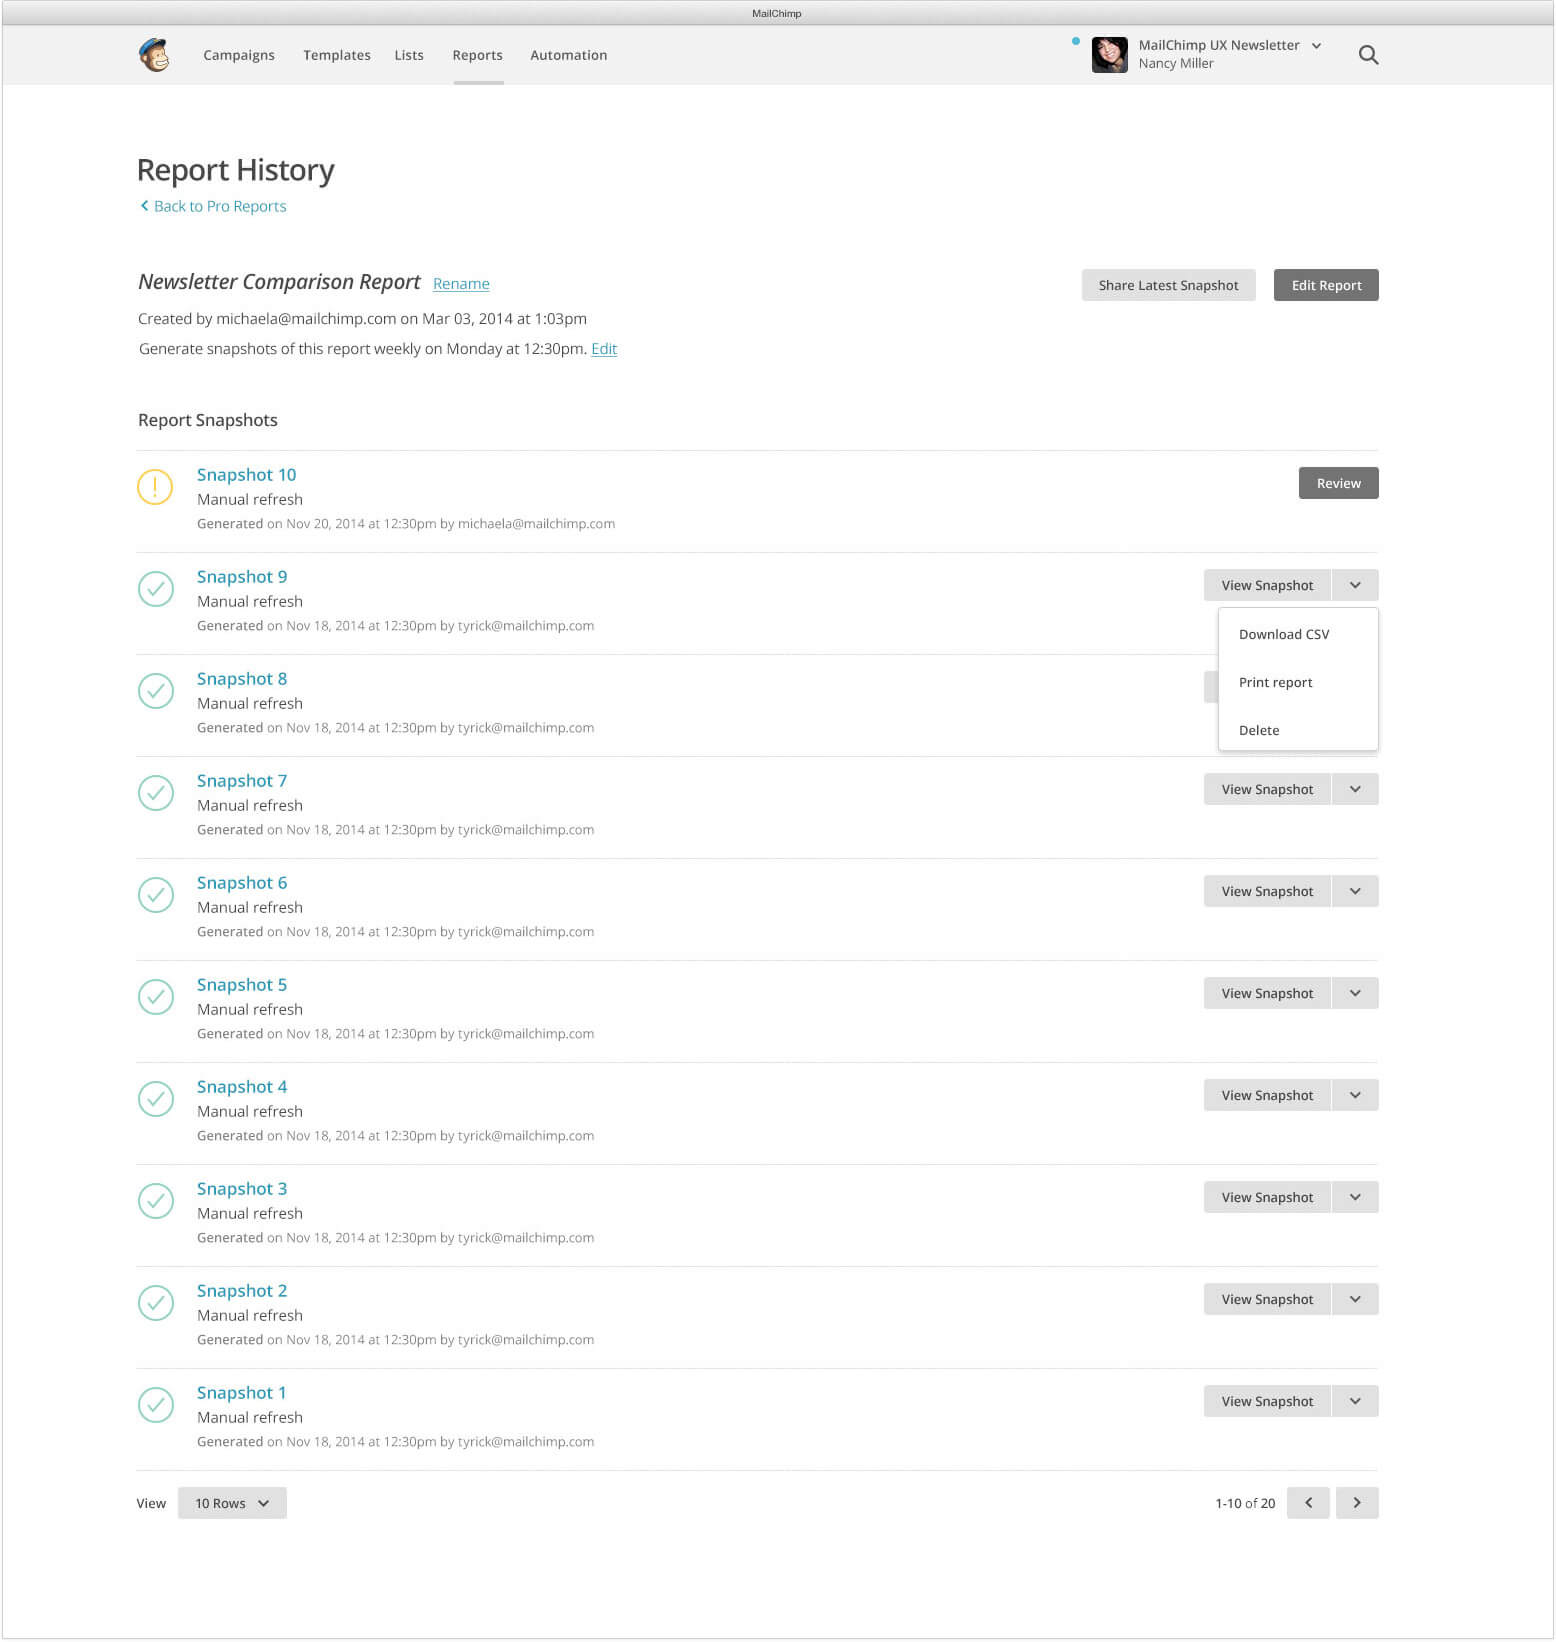
To simplify this process, we created a tool that let them compare campaigns sent to a list, then generate a report based on the selected campaigns. These campaigns could be manually filtered or dynamically filtered based on timeline, number of emails sent, title, and day sent. After the users selected the campaigns and generated a report, up to 4 subscriber segments could be added. This allowed users to discover trends or gain a better understanding of their subscribers by creating segments based on topics like gender, purchase preferences, or location. Within the report, the user could compare the open rate, click rate, unsubscribes, bounces, and abuse rates of the baseline against the segments. This report could then be saved, scheduled to generate over time, or shared.

Menus and popovers in comparative reports.
Comparative report modals.
An early version of the workflow for comparative reports.
An early idea for segmentation was to create a rule using a mad lib approach.
A sketch we used to build the final version of the segmentation interface.
The filtering step of comparative reports allowed the user to select any campaigns sent to a list.
The final version of a comparative report with 4 segments added.
The final version of the segmentation interface.
As criteria were added to segments, the opacity of the interface would be reduced to allow the user to focus.
The final version of the history page for comparative reports.